How to Deploy and Monitor ClickHouse Docker Containers
This guide walks through deploying ClickHouse containers using ServerBuddy's visual interface, covering both basic deployments and production configurations.
Prerequisites
Your Linux server needs:
- Docker or Podman installed
- 2GB+ available RAM
- 20GB+ free disk space
You can check Docker installation by navigating to the "Containers" tab or by running the following in the Terminal:
docker --version
# or
podman --version
Creating a ClickHouse Container with GUI
Step 1: Navigate to Docker Management
- Connect to your server via ServerBuddy
- Click the "Containers" tab
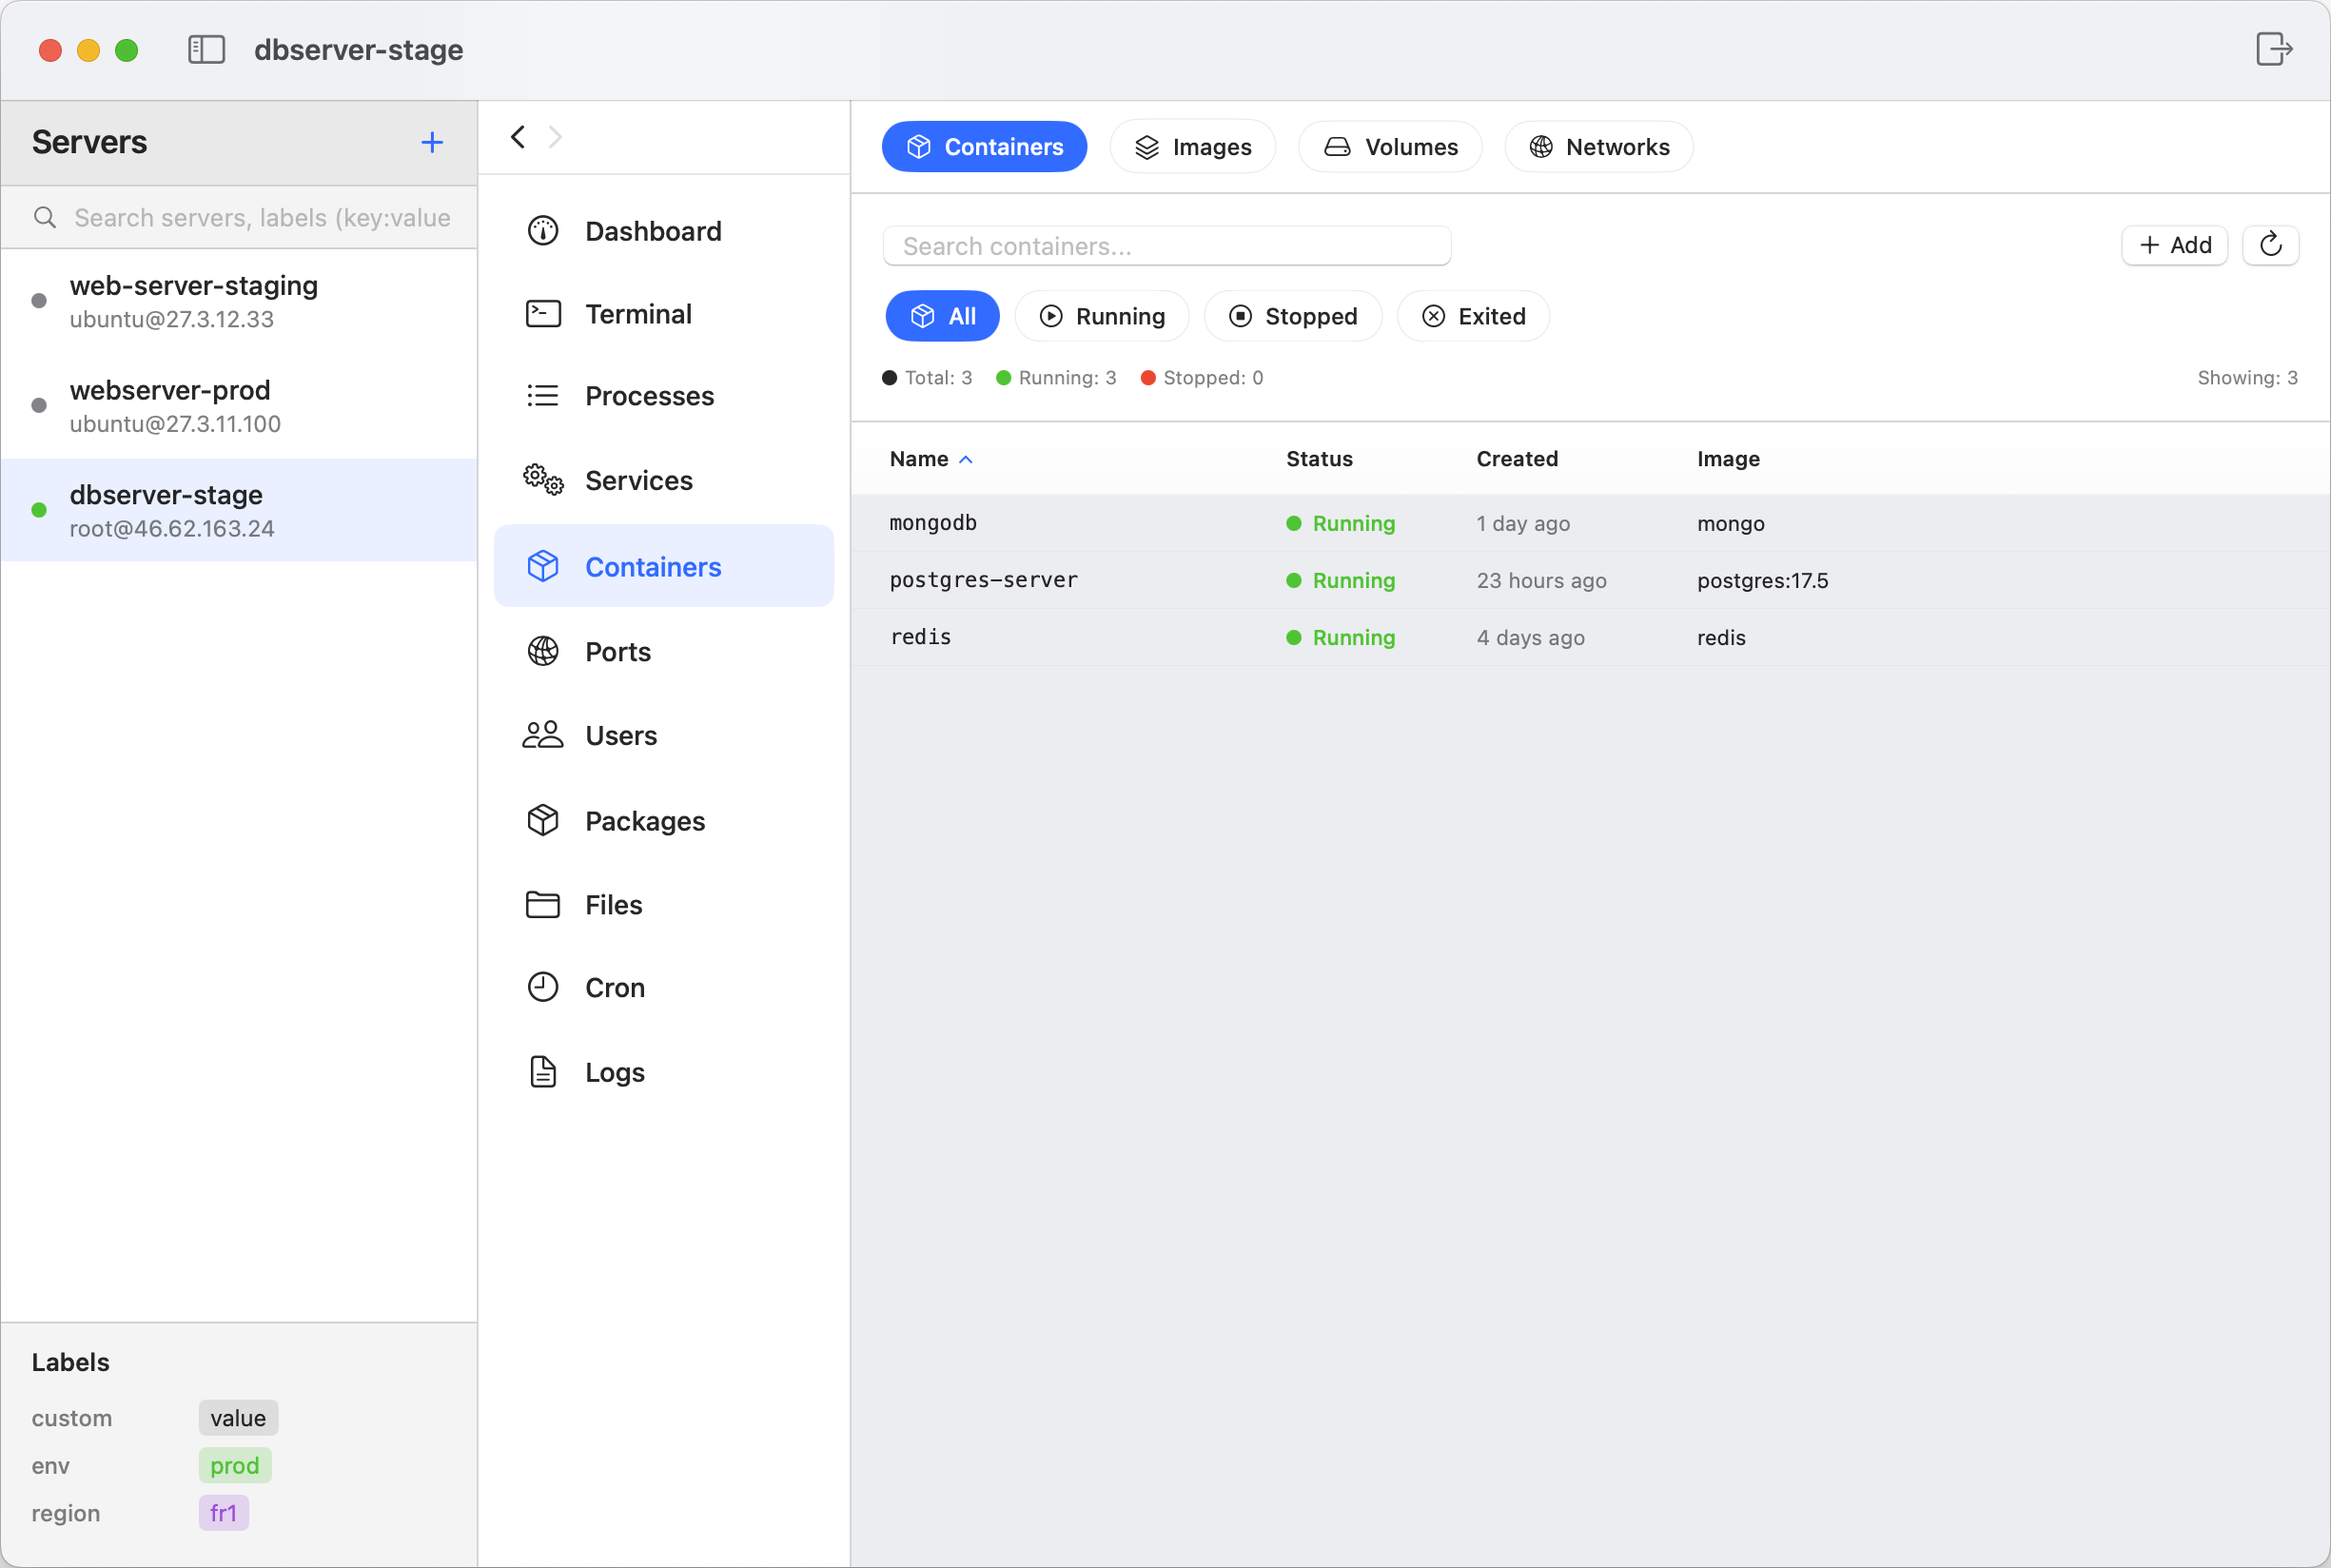
Step 2: Configure Container Parameters
Click the "+ Add" button in the top right to open the container dialog:
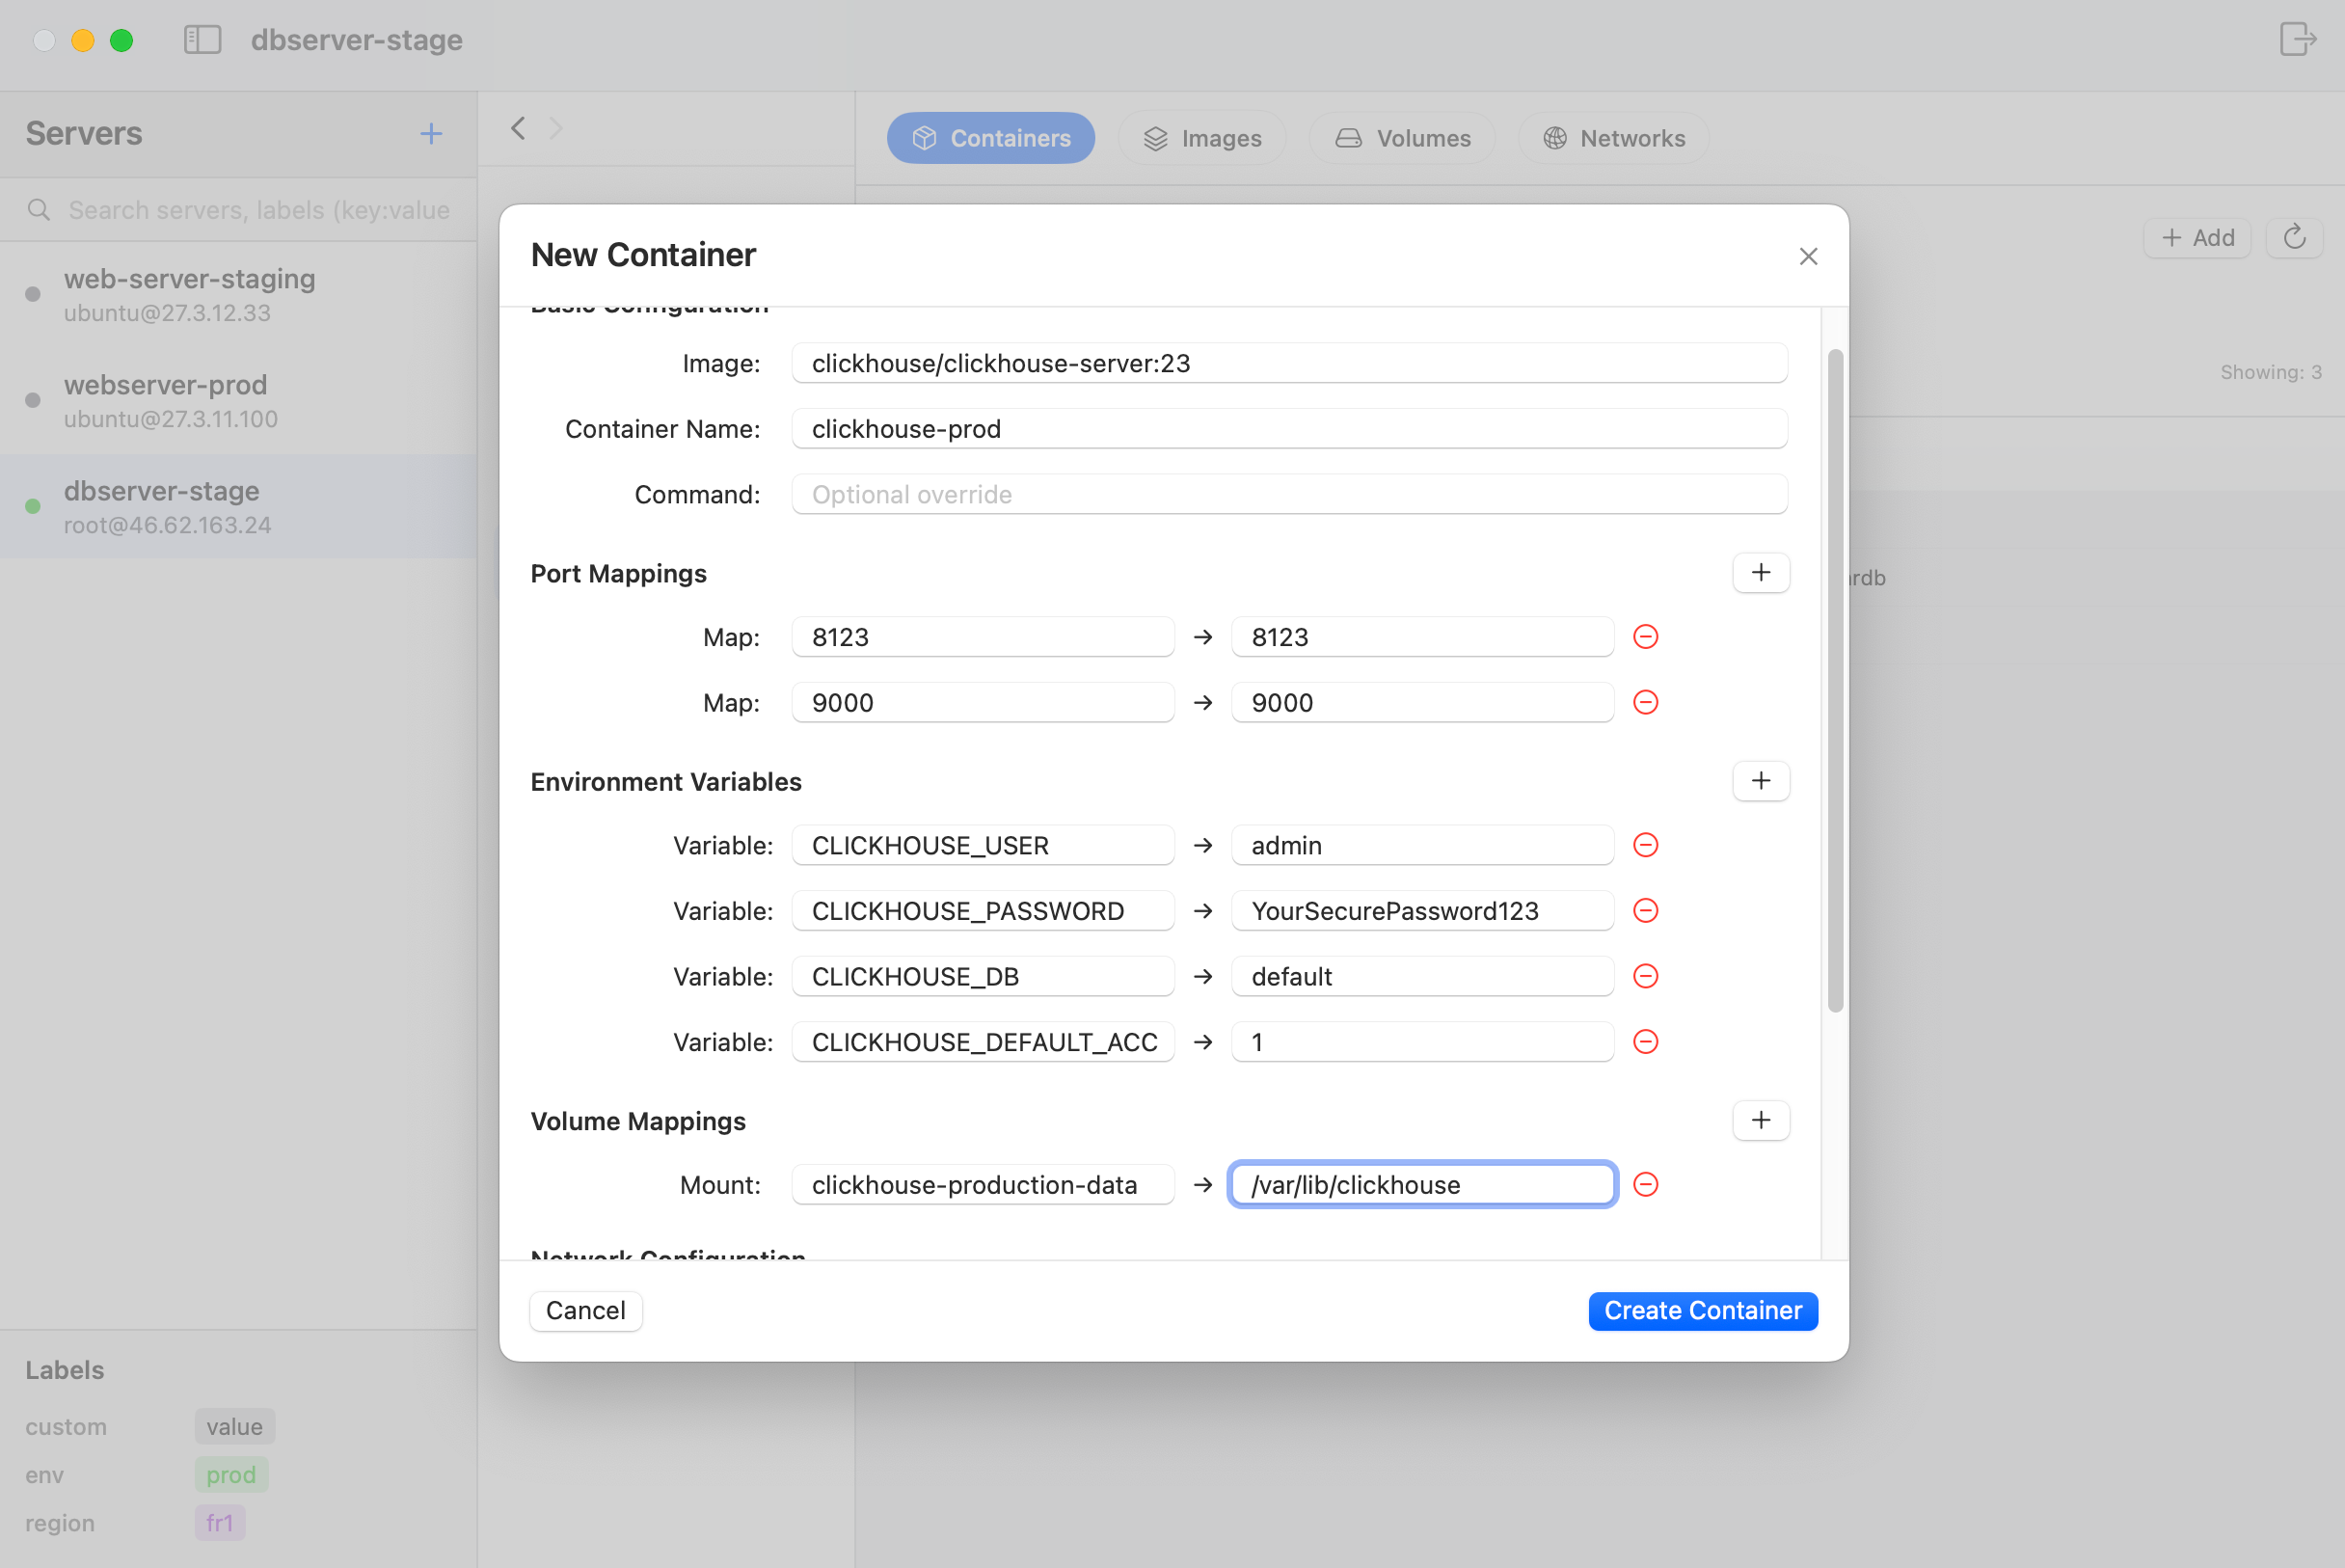
Basic Configuration
- Image:
clickhouse/clickhouse-server:23(official ClickHouse image) - Container Name:
production-clickhouse(descriptive naming) - Command: Leave empty (uses ClickHouse default entrypoint)
Port Mappings
Enter the following in the port mappings section:
- Host Port:
8123→ Container Port:8123(HTTP interface) - Host Port:
9000→ Container Port:9000(Native TCP protocol) - Host Port:
9440→ Container Port:9440(Secure TCP - optional) - Alternative: Use
8124on host if 8123 is occupied
Environment Variables (Critical for ClickHouse)
Add these essential ClickHouse environment variables:
| Variable | Value |
|---|---|
CLICKHOUSE_USER |
admin |
CLICKHOUSE_PASSWORD |
YourSecurePassword123! |
CLICKHOUSE_DB |
default |
CLICKHOUSE_DEFAULT_ACCESS_MANAGEMENT |
1 |
Volume Mappings for Data Persistence
Configure persistent storage to survive container restarts:
- Mount:
clickhouse-production-data(Docker volume name) - Container Path:
/var/lib/clickhouse
For logs persistence:
- Mount: clickhouse-production-logs (Docker volume name)
- Container Path: /var/log/clickhouse-server
For custom configuration (optional):
- Mount: clickhouse-config (Docker volume name)
- Container Path: /etc/clickhouse-server/users.d
This ensures your database persists even if the container is removed.
Network Configuration
- Choose custom network for multi-container applications
- ServerBuddy shows available networks in a dropdown
Runtime Options
- Restart Policy: Select "Unless Stopped" for production
- ✅ Run in detached mode: Keeps container running in background
- ❌ Remove on exit: Keep unchecked for databases
Step 3: Deploy the Container
Click "Create Container" to:
- Pull the ClickHouse image if not present
- Create volume directories
- Start the container with specified configuration
- Display creation status
The container should be running within 20-30 seconds.
Monitoring ClickHouse Container Health
Container Status Indicators
The Docker containers view displays:
Container Status Indicators
- 🟢 Green: Running healthy
- 🟡 Yellow: Starting/restarting
- 🔴 Red: Stopped or errored
- ⚪ Gray: Paused
Available Container Actions
Hover over the container row to access:
- Start/Stop/Restart controls
Checking ClickHouse Performance
Container Resource Usage
You can view this by double clicking on your container entry in the containers table.
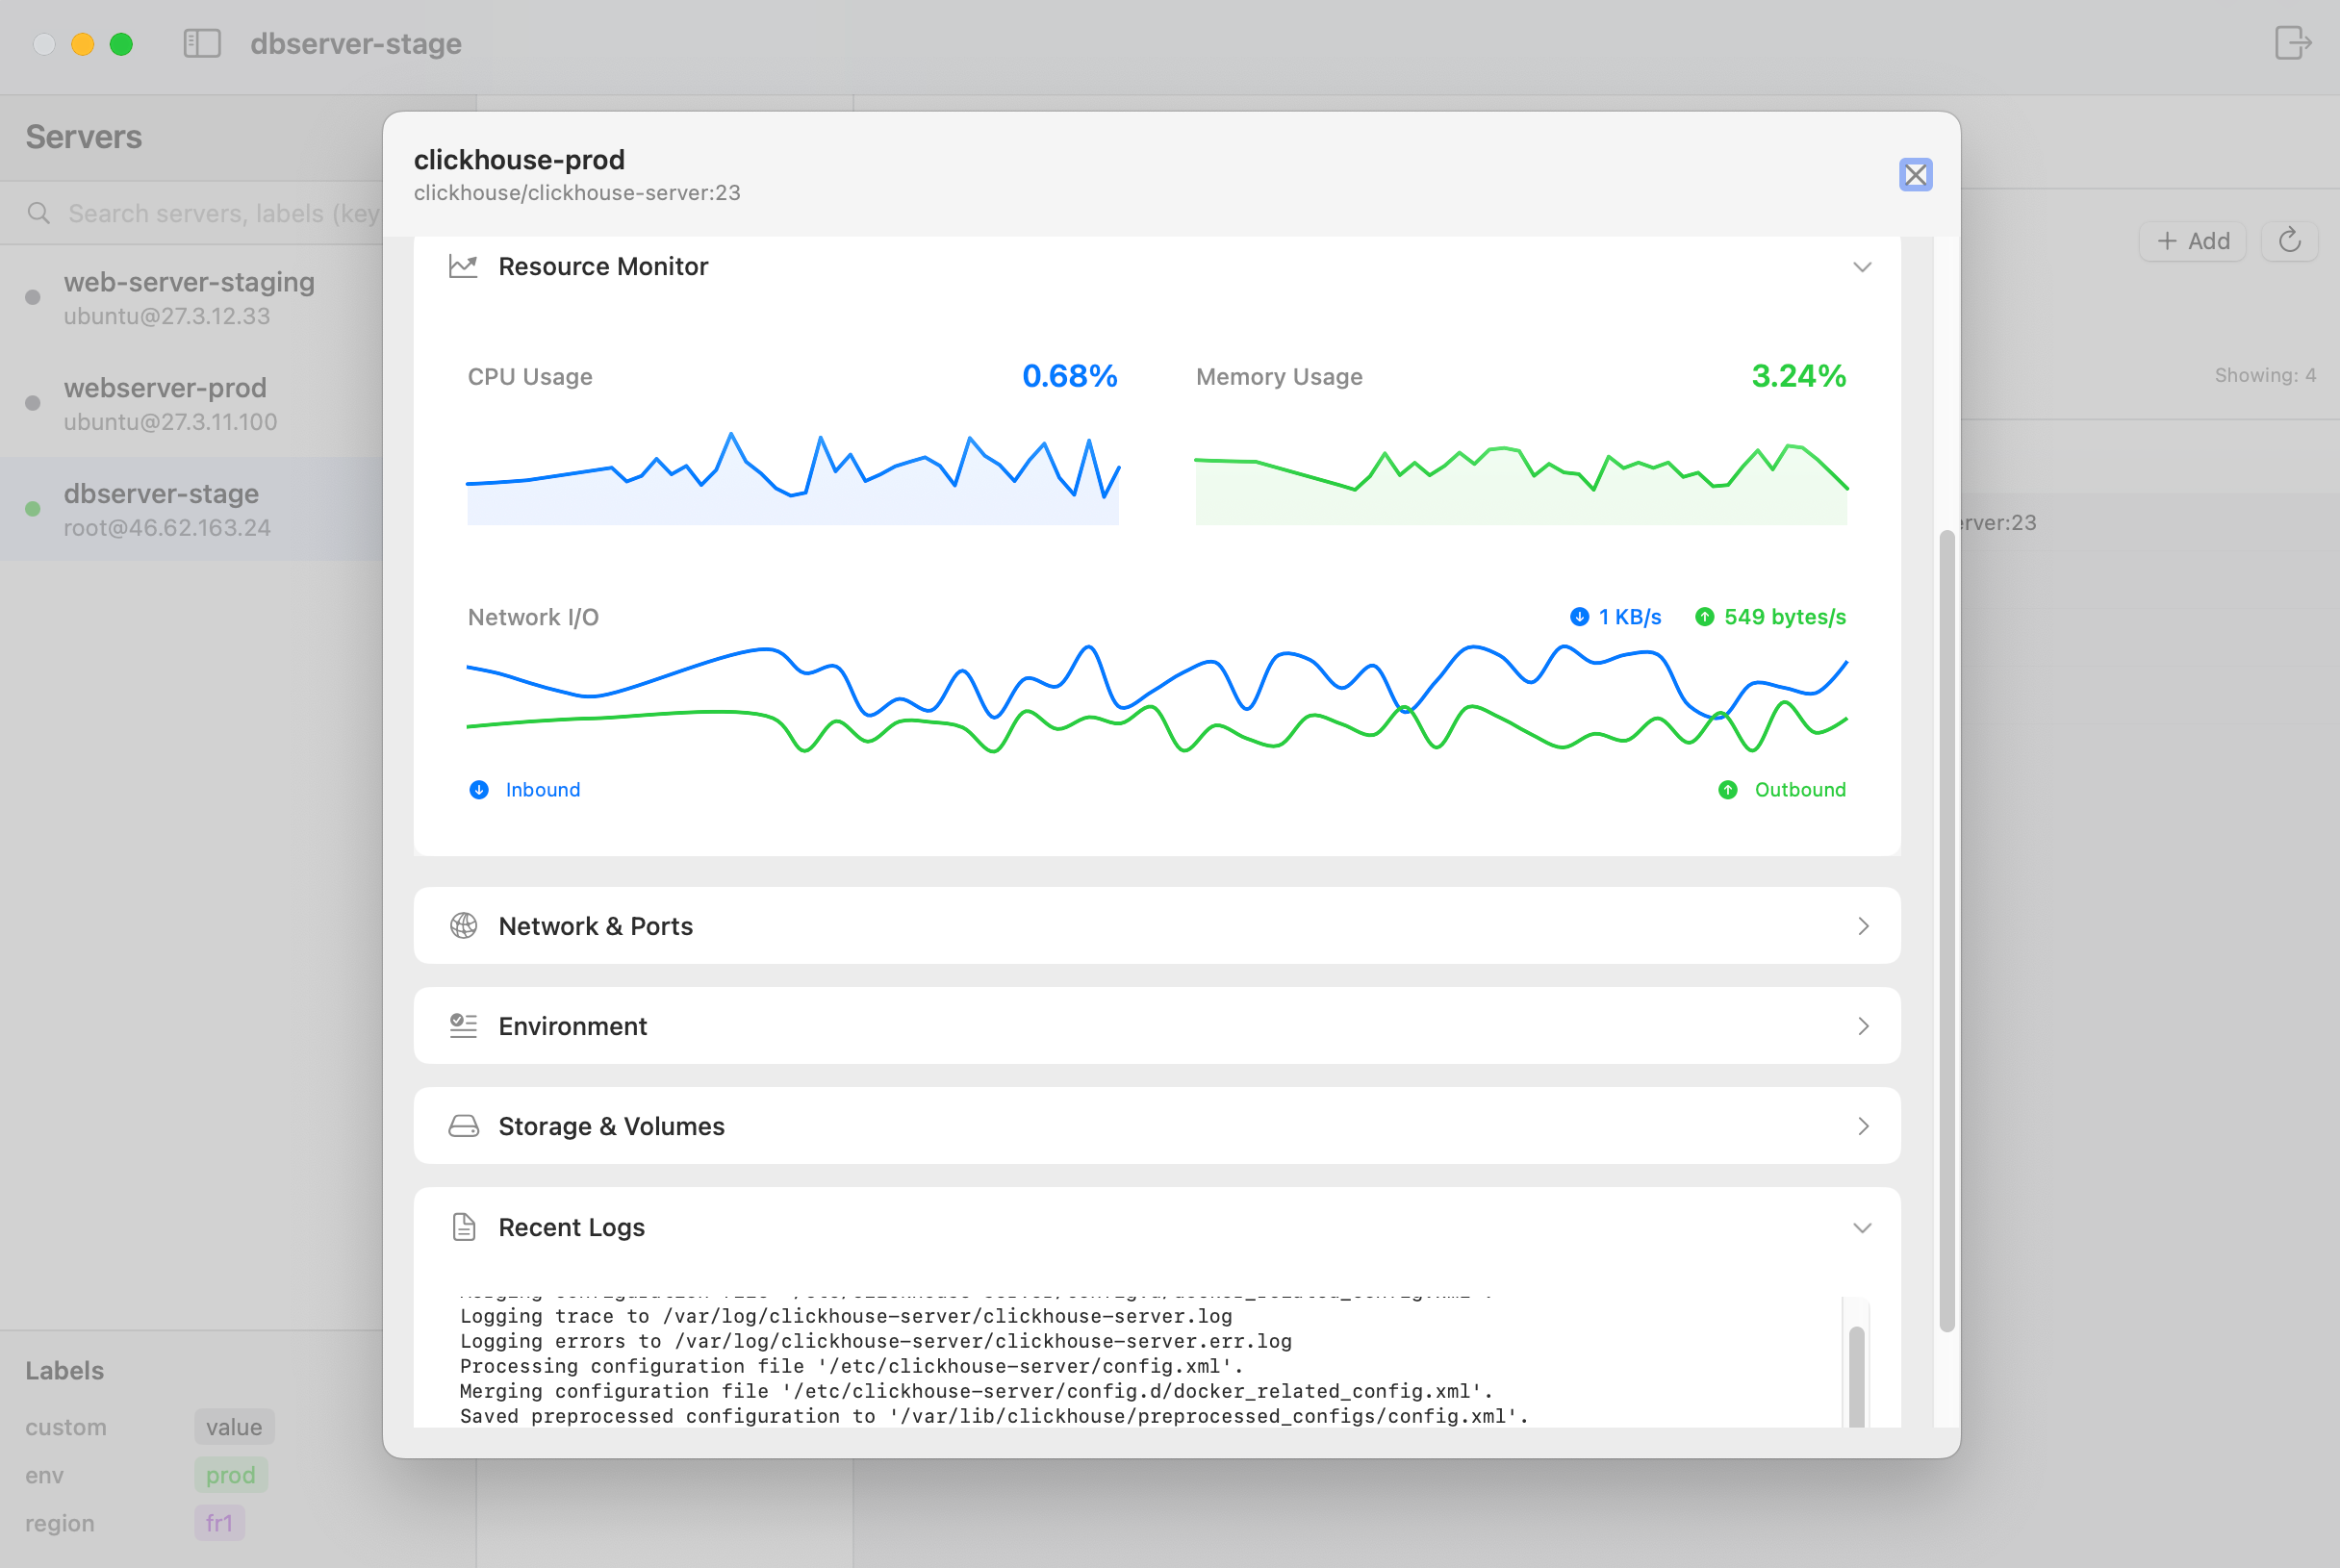
The container details view shows:
- Memory consumption vs. limits
- CPU usage percentage (real-time graph)
- Network I/O rates (inbound/outbound)
- Disk read/write operations
ClickHouse Internal Metrics
Connect via the Terminal tab:
- Click the Terminal tab
- Connect to ClickHouse container
Connect via ClickHouse client:
docker exec -it production-clickhouse clickhouse-client --user admin --password
Connect via HTTP interface:
curl -u admin:YourSecurePassword123! 'http://localhost:8123/?query=SELECT+version()'
Run performance queries:
-- System metrics
SELECT * FROM system.metrics LIMIT 10;

-- Query log
SELECT query, query_duration_ms FROM system.query_log ORDER BY event_time DESC LIMIT 10;

-- Table sizes
SELECT table, formatReadableSize(sum(bytes)) as size FROM system.parts GROUP BY table;

-- Active queries
SELECT query_id, user, query FROM system.processes;

-- Database statistics
SELECT name, engine, total_rows, total_bytes FROM system.tables WHERE database = currentDatabase();

-- Memory usage
SELECT metric, value FROM system.metrics WHERE metric LIKE '%Memory%';
HTTP Interface Access
ClickHouse provides a powerful HTTP interface for queries:
# Execute query via HTTP
echo "SELECT count() FROM system.tables" | curl 'http://localhost:8123/' --data-binary @-

# With authentication
curl -u admin:YourSecurePassword123! 'http://localhost:8123/?query=SELECT+1'

# Create table via HTTP
curl -u admin:YourSecurePassword123! 'http://localhost:8123/' -d 'CREATE TABLE test (id UInt32) ENGINE = Memory'
Log Analysis
You can view the logs for the container in the "Logs" tab by changing the log source to "Containers", and then selecting your container from the dropdown list.
The log viewer offers:
- Filtering by log level (ERROR, WARNING)
- Text search across logs
- Real-time updates
Troubleshooting Connection Issues
If you can't connect to ClickHouse: 1. Check port mapping in container details (8123 for HTTP, 9000 for native) 2. Review container logs for authentication errors 3. Verify CLICKHOUSE_PASSWORD environment variable is set 4. Confirm firewall rules allow the connections 5. Test HTTP interface with curl command
Security Best Practices
- Always set strong passwords via CLICKHOUSE_PASSWORD
- Enable access management with CLICKHOUSE_DEFAULT_ACCESS_MANAGEMENT=1
- Use SSL/TLS for secure connections (port 9440)
- Limit port exposure to specific IPs when possible
- Configure user quotas and query complexity limits
- Set resource limits to prevent resource exhaustion
- Implement regular backup strategy
- Monitor query performance and kill long-running queries
Common Issues and Solutions
Container Won't Start
- Check logs for error messages
- Verify ports 8123 and 9000 are available
- Ensure image exists and is pulled
- Check volume mount permissions
- Verify ulimits are set correctly
Connection Refused
- Confirm container is running
- Verify port mappings (8123, 9000)
- Check firewall rules
- Test with curl to HTTP interface
- Review authentication credentials
Query Performance Issues
- Check system.query_log for slow queries
- Monitor memory usage via system.metrics
- Verify appropriate table engines are used
- Review partition and index strategies
- Consider adjusting max_memory_usage setting
Key Takeaways
- Always use volumes for data persistence at
/var/lib/clickhouse - HTTP interface on 8123: Easy access for queries and monitoring
- Native protocol on 9000: For client applications
- Set ulimits: Required for production workloads
- Configure resource limits to prevent container from consuming all system resources
- Use restart policies for automatic recovery
- Monitor query performance using system tables
- Backup regularly using clickhouse-backup or native tools